
Warehouse operations KPIs are the metrics that measure how fast and how reliably product moves through a facility, covering things like on-time-ship rate, dock-to-stock time, and order cycle time rather than just whether counts match. Shipider tracks these through the same audit trail it uses for maker-checker verification, so every receipt, putaway, pick, and dispatch has a timestamp you can turn into a real operational metric.
Why accuracy alone doesn't tell the whole story
Inventory accuracy answers one question: does the system count match the physical count. That matters, and we've covered it in depth in our inventory accuracy KPIs guide. But a warehouse can be 99% accurate and still be a mess to run. Trucks can sit at the dock for hours before anyone scans them in. Orders can take three days to leave the building when customers expect one. Pickers can walk the same aisle four times because nobody is watching lines-per-hour.
Accuracy is a quality metric. The KPIs in this article are speed and flow metrics. Together they tell you whether the warehouse is both correct and fast, which is what actually keeps customers and 3PL clients happy.
The core warehouse operations KPIs to track
On-time-ship rate
On-time-ship rate is the percentage of orders that leave the warehouse by the promised ship date. The formula is straightforward: orders shipped on or before the committed date, divided by total orders shipped, times 100.
This number is the one your customers and clients actually feel. A 3PL with strong accuracy but a weak on-time-ship rate will still lose contracts, because the client's promise to their own customer depends on your dock, not your cycle count. Tracking this requires two clean timestamps: when the order was promised and when it actually left. If those timestamps live in different systems (a spreadsheet for promise dates, a carrier portal for actual ship time), the KPI becomes a monthly reconciliation project instead of a live number.
Dock-to-stock time
Dock-to-stock time measures how long it takes inventory to go from arriving at the dock to being available to pick, which usually means scanned, putaway to a warehouse location, and reflected in system stock. It's calculated as the time of putaway confirmation minus the time of receiving check-in, averaged across receipts.
Long dock-to-stock times usually point to one of three things: receiving is understaffed relative to inbound volume, putaway decisions (which location does this pallet go to) are slow because there's no clear slotting logic, or there's a gap between physical putaway and system confirmation, meaning stock is on the shelf but not yet sellable in the system. We wrote a full breakdown of the handoff itself in receiving to put-away best practices, which is worth reading alongside this KPI since the process and the metric are the same thing viewed from two angles.
Order cycle time
Order cycle time is the total elapsed time from when an order is released to the warehouse to when it's packed and ready for carrier pickup. It typically breaks into three sub-stages: time to pick, time to pack, and time waiting between the two (queue time). Order cycle time equals pick completion time plus pack completion time plus any idle time in between.
Watching the whole cycle instead of just "did we ship on time" matters because it shows you where the order actually sits still. A warehouse can hit its on-time-ship rate by having staff work overtime at the end of the day, which hides a slow middle. Order cycle time exposes that pattern. If pick time is short but total cycle time is long, the bottleneck is usually in packing capacity or in orders sitting in a queue waiting for a checker to verify them, which is a good argument for tightening the maker-checker handoff rather than removing verification altogether. Our piece on what a maker-checker workflow actually is covers how to keep that second check fast instead of a bottleneck.
Supporting KPIs worth tracking alongside the big three
A few second-tier metrics round out the picture and usually explain the movement in the three above:
- Picking productivity (lines per hour): total order lines picked divided by picker hours worked. Low numbers often trace back to slotting, not the picker; see our guide on warehouse slotting and location strategy.
- Putaway time per pallet: average minutes from receiving scan to shelf confirmation for a single pallet, useful for spotting congestion at specific locations.
- Dock door utilization: percentage of scheduled dock time actually used for active loading or unloading, which flags scheduling gaps before they show up as slow dock-to-stock time.
- Backorder rate: percentage of order lines that can't be filled at release, which inflates order cycle time in ways that look like a picking problem but are actually a purchasing problem.
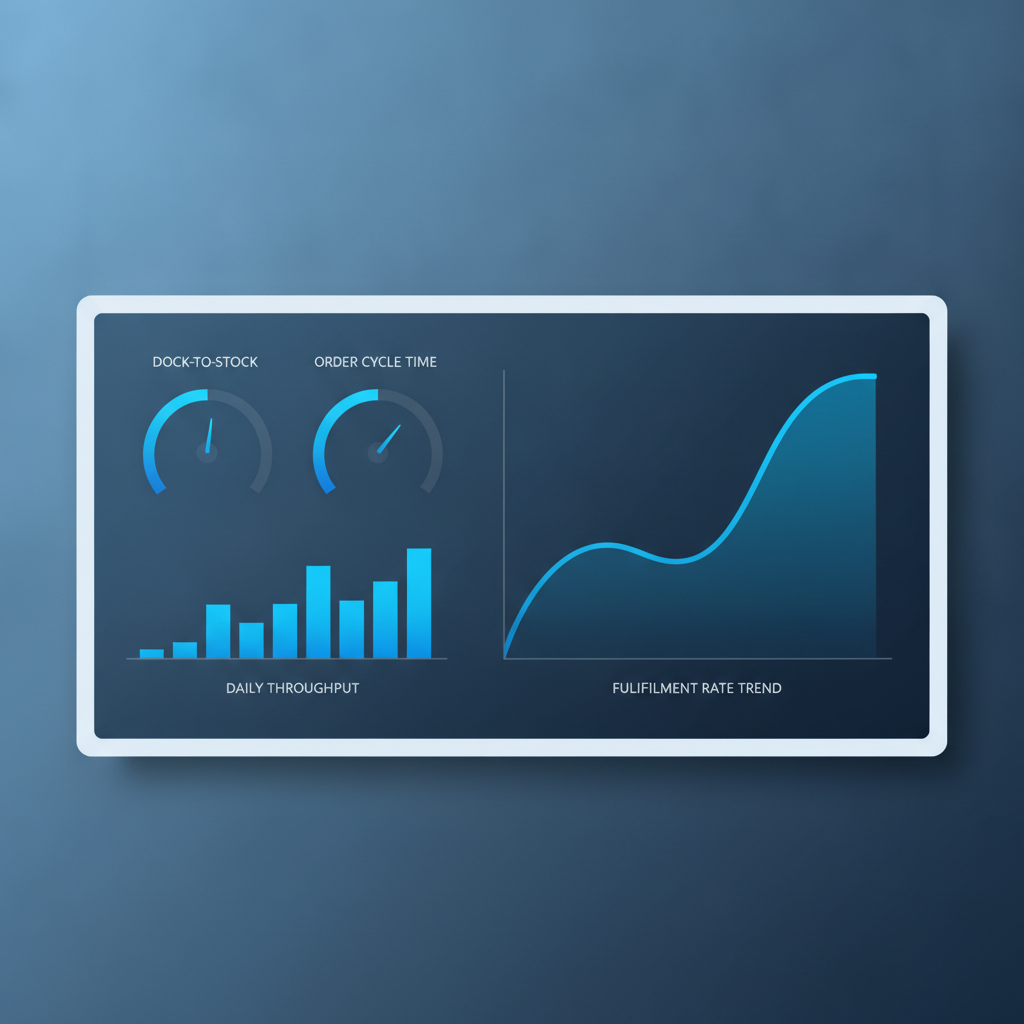
KPI reference table
| KPI | What it measures | Formula | Where the data usually breaks |
|---|---|---|---|
| On-time-ship rate | Orders shipped by promised date | (orders shipped on time / total orders shipped) x 100 | Promise date and actual ship time live in different systems |
| Dock-to-stock time | Speed from receiving to sellable stock | putaway confirmation time minus receiving check-in time | Physical putaway happens before system confirmation |
| Order cycle time | Total time from order release to pack complete | pick time + pack time + queue time between them | No timestamp captured between pick and pack stages |
| Picking productivity | Output per picker hour | order lines picked / picker hours worked | Travel time and re-picks aren't separated from productive time |
| Dock door utilization | How well dock schedules match actual activity | (active dock time / scheduled dock time) x 100 | No record of actual truck arrival versus appointment time |
Industry-specific benchmark ranges for each of these vary by vertical and order profile. [NEEDS VERIFICATION: typical benchmark ranges for on-time-ship rate, dock-to-stock time, and order cycle time by warehouse type] rather than a single number that applies to every operation.
How to track these KPIs without a spreadsheet mess
The reason most warehouses track accuracy but not speed is simple: accuracy can be checked with a periodic count, while speed metrics need timestamps captured at the moment work happens. That's hard to do reliably with paper logs or a spreadsheet someone updates at the end of a shift, because the actual scan time and the logged time drift apart.
This is where camera-based barcode scanning changes the math. When receiving, putaway, picking, and dispatch are all scanned from a phone browser, each action gets a real timestamp automatically, no separate data entry step required. Shipider builds every one of these KPIs from that same scan history: dock-to-stock time comes from the receiving scan and the putaway scan on the same pallet or SKU, order cycle time comes from the order release event through the pack and dispatch scans, and on-time-ship rate compares the dispatch scan against the promised date on the order.
Because the underlying data is a real audit trail rather than a manually updated log, you can pull these numbers for a single site or roll them up across multi-site inventory without reconciling three spreadsheets first. For a 3PL running several client operations under one roof, that also means each client's KPIs stay isolated to their own data, since Shipider's multi-tenant structure keeps one client's dock-to-stock numbers from bleeding into another's report.
Where Shipider fits into KPI tracking
Shipider isn't a business intelligence tool bolted onto a spreadsheet export. The KPIs above come out of the same operational flow the warehouse already uses: receiving, putaway to a warehouse location, pallet and SKU tracking, order processing with a two-step maker-checker check, and dispatch. Because every step is scanned and timestamped on the floor, the KPI numbers are a byproduct of doing the work, not a separate reporting task bolted on afterward.
That matters most for teams that outgrew Excel but don't want a six-month rollout to get real operational visibility. There's no scanner hardware to buy since scanning runs in any phone's browser, and pricing is token-based rather than a per-seat license, so adding visibility into dock-to-stock time or order cycle time doesn't require a new module purchase. If you're comparing this approach against a spreadsheet-based setup, our WMS vs spreadsheets breakdown covers the tradeoff in more detail, and our pricing page lays out how the token model works.
For e-commerce brands managing their own fulfillment, the same KPIs apply at a smaller scale: on-time-ship rate against carrier cutoffs, order cycle time from cart to pack station. Our e-commerce fulfillment solution page covers how that looks in practice.
Frequently asked questions
What is the difference between order cycle time and on-time-ship rate?
Order cycle time measures how long an order takes to move through picking and packing once it's released, while on-time-ship rate measures whether the order left the building by its promised date. A warehouse can have a short cycle time but still miss ship dates if orders sit unreleased, or a long cycle time but still ship on time if promise dates are generous.
How is dock-to-stock time calculated?
Dock-to-stock time is the elapsed time between when a shipment is checked in at receiving and when it's confirmed as putaway to a warehouse location and available in system stock. It's calculated by subtracting the receiving check-in timestamp from the putaway confirmation timestamp, then averaging across all receipts in a period.
Why should a warehouse track operational KPIs beyond inventory accuracy?
Inventory accuracy only shows whether counts are correct, not whether the warehouse is fast or reliable. KPIs like on-time-ship rate, dock-to-stock time, and order cycle time capture speed and flow, which is what drives customer satisfaction, 3PL client retention, and labor costs, even in a warehouse with strong accuracy numbers.
Can these KPIs be tracked without barcode scanners or extra hardware?
Yes. Timestamps for receiving, putaway, picking, and dispatch can be captured through camera-based barcode scanning that runs in a phone's browser, which removes the need for dedicated scanner hardware while still producing the scan-level data these KPIs are built from.
What causes a slow order cycle time even when picking is fast?
Queue time between stages is the most common cause: an order can be picked quickly but then sit waiting for packing capacity or a maker-checker verification step before it moves forward. Tracking the sub-stages of order cycle time separately (pick, queue, pack) usually reveals which stage is actually the bottleneck.
Ready to see these KPIs come from your own floor instead of a spreadsheet? Create a free Shipider account and start tracking dock-to-stock time and order cycle time from day one.
Related reading: Cross-Docking Basics for Small and Mid-Size Warehouses
Related reading: Warehouse Layout Design for Small Warehouses on a Tight Budget